EXCLUSIVE REPORT! Indianapolis Remains America’s 11th Largest City! But Growth Lags Behind Other Major Cities

Indy’s Grown 2.8% since 2010, but our growth isn’t keeping pace with other cities
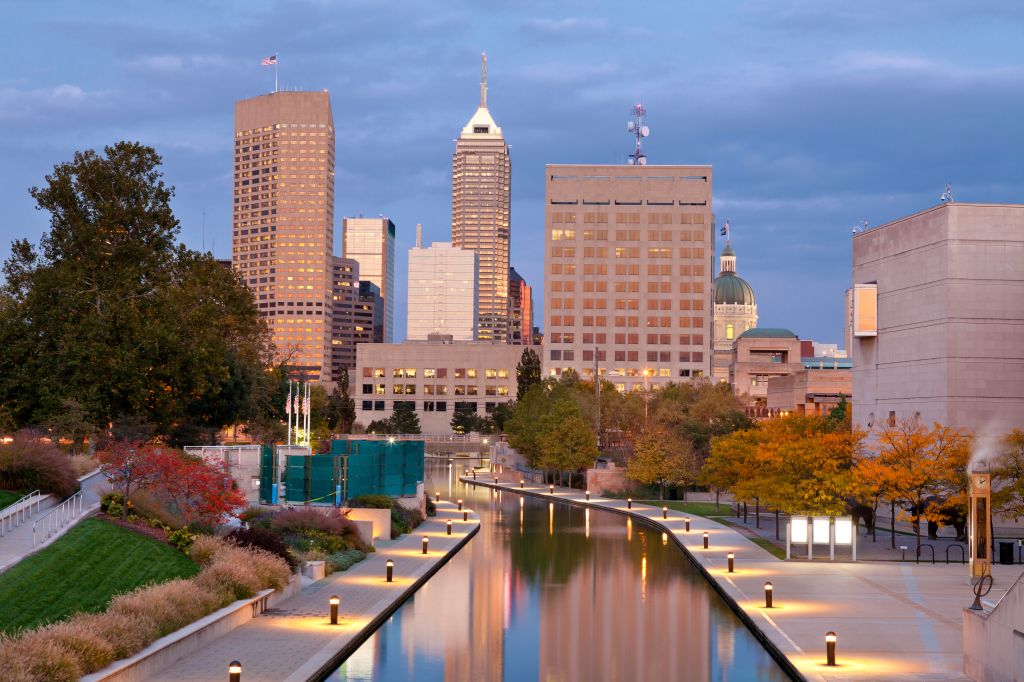
As a city and city/county, Indianapolis continues to demonstrate strong population growth compared to the last decade. But our city’s growth isn’t matching the strong population growth other major American cities are experiencing. That’s the results observed from the latest population estimates released by the Census Bureau. According to the latest 2013 population estimates released Thursday (May 22nd) by the Census Bureau, Indianapolis/Marion County grew by 24,288 persons since between the 2010 Census and the 2013. That’s an overall growth rate of 2.8%
The population of the full consolidated city of Indianapolis/Marion County is 928,281 which places the city again as the eleventh largest in the country.
(Note: Because of the role of the unified government while there are some individual towns and city within the city/county, the Census Bureau provides several estimates of Indianapolis’ population. The designations of Indianapolis city and Indianapolis city (balance) by the Census Bureau makes comparisons Indy with other major cities tricky. We use the full city/county measurement). Within Indiana, Indianapolis’ growth is stellar among the state’s other major cities. An analysis by Indiana University’s Business Research Center documented the state’s capital growth in the first third of this decade. Said IU, “Indiana’s four largest cities — Indianapolis, Fort Wayne, Evansville and South Bend — have experienced dramatic increases in population change over the past three years, according to estimates”. After Indianapolis, Fort Wayne continues as the Indiana’s second largest city at 256,496; up 2,805 or 1.1% since 2010. Next is Evansville which has grown to 120,310 up 2.5% or 2,881 since 2010. In fourth place is South Bend at 100,886, down 0.3% or -282 since 2010. Carmel (85,927) and Fishers (83.891) as expected are neck and neck as the fifth and sixth largest Indiana cities. But Fishers growth since the 2010 Census has exceeded Carmel’s. Fishers has grown by 9.2% compared with 8.5% for Carmel. If that trend continues, Fishers will surpass Carmel in population in the next couple of years. Bloomington ranks seventh at 82.575; up 2.7%. Rounding out the top ten Indiana cities are Hammond 78,967, down 2.3%; Gary 78,450, down 2.3% and Lafayette edging Muncie as the state’s tenth largest at 70,316 up 0.3%. After Muncie, is Terre Haute, now Indiana’s 12th largest city 61,025; up 0.4%. Followed by: Kokomo at 56,895; up a strong 25.1% due to annexations. Fourteenth is Noblesville at 56,540 up 8.8%; then Anderson 55,670 down -0.8%; Greenwood is 16th at 53,665, up 7.8%; then Elkhart 51,265, up 0.6%; followed by Mishawaka 47,989, down -0.5%; then Lawrence 47,135, up 2.5% and the 20th largest Hoosier city is Jeffersonville 45,929, up 2.2%. Eleven of Indiana’s Top Twenty cities are located in Central Indiana. And seven of Indiana’s Top Twenty cities are in located in the Indianapolis/Carmel/Anderson Metro Area.

Minneapolis has grown 4.6% since 2010
Columbus Ohio has grown 4.5% since 2010
Among the nation’s largest cities, Indianapolis’ growth rate, while stronger than the previous decade is lagging behind the nation’s other top cities, including some key cities in the Northeast and Midwest which are showing strong resilient growth so far since 2010. Among the nation’s thirty largest cities, Indianapolis’ 2.8% growth since 2010 was tied for ninth lowest. Cities in the South and West exhibit among the strongest population growth this decade. Though Indianapolis’ 2.8% growth exceeds Los Angeles’ 2.4% growth. Of the top cities in the Northeast and Midwest, Indianapolis’ 2.8% growth doesn’t stack up well against cities whose populations are having stellar growth rates so are since 2010. Leading the way is Washington DC whose population has soared 7.4% this decade. The nation’s capital is followed by Minneapolis and Boston both at 4.6% growth, then Columbus Ohio 4.5%, St. Paul (Minnesota) 3.4%, then Indianapolis which is tied with New York City at a 2.8% growth rate since 2010. But Indianapolis’ population growth rate far exceeds other key Northeastern and Midwestern cities. Including Louisville 2.1%; Philadelphia 1.8%; Kansas City 1.6%; Chicago 0.9%, Milwaukee 0.7%; Newark 0.5%; Pittsburgh 0.4%; Baltimore and Cincinnati 0.2%. And Indy’s far ahead of major Midwestern and northeastern cities who have lost population so far this decade like Detroit down 3.5%; Cleveland -1.7%; St. Louis -0.3%
TOP 30 CITIES RANKED BY 2013 POPULATION ESTIMATES
2013 Census Population Estimates Chart Compilation ©2014WTLC/Radio One
CITY 2010 POP 2013 EST %GWTH
New York 8,175,133 8,405,837 2.8%
Los Angeles 3,792,621 3,792,622 2.4%
Chicago 2,695,598 2,718,782 0.9%
Houston 2,099,451 2,195,914 4.6%
Philadelphia 1,526,006 1,553,165 1.8%
Phoenix 1,445,632 1,513,367 4.7%
San Antonio 1,327,407 1,409,019 6.1%
San Diego 1,307,402 1,355,896 3.7%
Dallas 1,197,816 1,257,676 5.0%
San Jose 945,942 998,537 5.6%
INDY 903,393 928,281 2.8%
Austin 790,390 885,400 12.0%
Jacksonville 821,784 842,583 2.5%
San Francisco 805,235 837,442 4.0%
Columbus 787,033 822,553 4.5%
Charlotte 731,424 792,862 8.4%
Fort Worth 741,206 792,727 7.0%
Detroit 713,777 688,701 -3.5%
El Paso 649,121 674,433 3.9%
Memphis 646,889 653,450 1.0%
Seattle 608,660 652,405 7.2%
Denver 600,158 649,495 8.2%
Washington 601,723 646,449 7.4%
Boston 617,594 645,966 4.6%
Nashville 601,222 634,464 5.5%
Baltimore 620,961 622,104 0.2%
Oklahoma City 579,999 610,613 5.3%
Louisville 597,337 609,893 2.1%
Portland 583,776 609,456 4.4%
Las Vegas 583,756 603,488 3.3%